Uber Voices
Negating controversies and amplifying empathy for ethnic minorities.
#notoracism
#notoracism
— TEAMMATES
Aahel Iyer
— MY ROLES
UX Researcher
UX Designer
Content Developer
— TOOLS USED
Balsamiq, Sketch, Figma, Miro
THE CHALLENGE
Uber drivers in the United States are primarily represented by ethnic minorities. Often, these ethnic minorities are subject to hate crimes and blatant misjudgement. We wanted to enable a process that puts both rider and driver at ease that could well become the start of a great friendship and also bridge cultural barriers.
THE SOLUTION
By leveraging the power of Ubers immense workforce we integrated an empathetic tool that creates an everlasting bond between rider and driver.
APPROACH
Research
Literature Review
Discovery & Research Aggregation
Personas, Empathy Mapping, User Journeys
Design
Paper Prototyping, Wireframes, Visual Designs
Evaluation
Further Design Considerations
Reflection
Key Takeaways
MY CONTRIBUTION
During the research phase I conducted a literature review on hate crimes against ethnical minorities, especially towards Uber chauffeurs.
During the discovery and research aggregation phase I pooled together all the data from my research phase and visually represented it making use of empathy maps, personas, journey maps, etc. My teammate- Aahel, also actively took part with me in this part of the project.
I mocked up paper prototypes before moving on to wireframing and then finally visually designing the features we planned to incorporate into the Uber application.
Finally I thought of different design iterations as I assessed and evaluated the final design outcome with my teammate.
drag the slider below!
Uber Voices // Concept Video
Literature Review
My main findings based on the extensive literature review I conducted were as follows:-
1. Hate crimes stem from major misunderstanding and misinterpretation of a particular culture/ race.
2. Race/ Ethnicity comprises of the largest biggest bias motivational category for hate crime incidents
3. Perpetrators of hate crimes are not always motivated by a single type of prejudice or hatred but can be influenced by a combination of different prejudices.
4. The FBI reported 7,145 hate crimes in 2017; however, the majority of hate crimes are never reported, so these data underestimate the true pervasiveness.
5. Reported hate crimes in 2017 were motivated by hostility based on race/ethnicity (58.1 percent), religion (22.0 percent), sexual orientation (15.9 percent), gender identity (.6 percent) and disability (1.6 percent). Hate crimes targeted Jewish, African-American and LGBT communities at high rates.
6. Evidence of hate crime causation is not yet conclusive. However, there is some evidence within social psychology to suggest that perpetrators may be influenced by their perception that certain groups pose a threat to them. These threats can be divided into ‘realistic threats’ – such as perceived competition over jobs, housing and other resources, and physical harm to themselves or others – and ‘symbolic threats’ which are concerned with the threat posed to people’s values and social norms.
Sources:
1. https://ucr.fbi.gov/hate-crime/2017/topic-pages/incidents-and-offenses
2. https://ucr.fbi.gov/hate-crime/2017s://ucr.fbi.gov/hate-crime/2017
3. https://www.equalityhumanrights.com/sites/default/files/research-report-102-causes-and-motivations-of-hate-crime.pdf
4. https://edition.cnn.com/2017/06/02/us/who-commits-hate-crimes/index.html
5. https://www.apa.org/advocacy/interpersonal-violence/hate-crimes
Personas
My teammate and I mocked up the following personas based on our findings from the literature review we conducted. These user personas helped us in guiding our design by understanding the goals and motivations of the users here (the Uber driver and the rider). Since we were not able to interview any Uber drivers in America nor any hate crime perpetrators, we solely relied on the findings and data from the literature review.
Empathy Mapping
We made use of empathy maps because as we really wanted to understand the sensory impact from a holistic perspective, derive key insights, understand our target personas better and get even more intimate with our audience. It helped us uncover what our personas see, think, say, feel (not observed, rather inferred) and do.
User Journeys
To further empathise with our user group and discover more opportunities during different phases of the driver journey, we made use of journey maps. Breaking down the driver journey into different steps, with each of them having their own needs, pains, feelings and opportunities pushed my teammate and I to think not only broadly but also deeply.
the opportunity area
PEOPLE + NEED +INSIGHT
chauffeurs: who represent an ethnic minority
need: a platform
insight: to share their unique story and culture
Paper Prototyping
Despite me not exhibiting exceptional skill with a pencil, the paper prototypes, served as a vital gateway for hashing out ideas quickly.
Wireframes
Stepping the prototypes up a notch, I mocked up wireframes from the initial sketches drawn.
Visual Designs
Negating controversies and amplifying empathy- one ride at a time.
Rider View (Pre Ride)
Informative modals before every ride remind the rider of rules to adhere to during the duration of the ride. Thus, reinforcing Uber’s core values and safety norms.
(Pre Ride)
1) We humanised the experience by adding unique rider interests. These are displayed to the driver before and during the ride. The unique interests act to serve as ice breakers that facilitate conversation between rider and driver.
(During Ride)
1) During rides, incase the driver is at a risk they can easily reach out for help from the main screen itself.
2) Unique rider interests remain viewable throughout the duration of the ride.
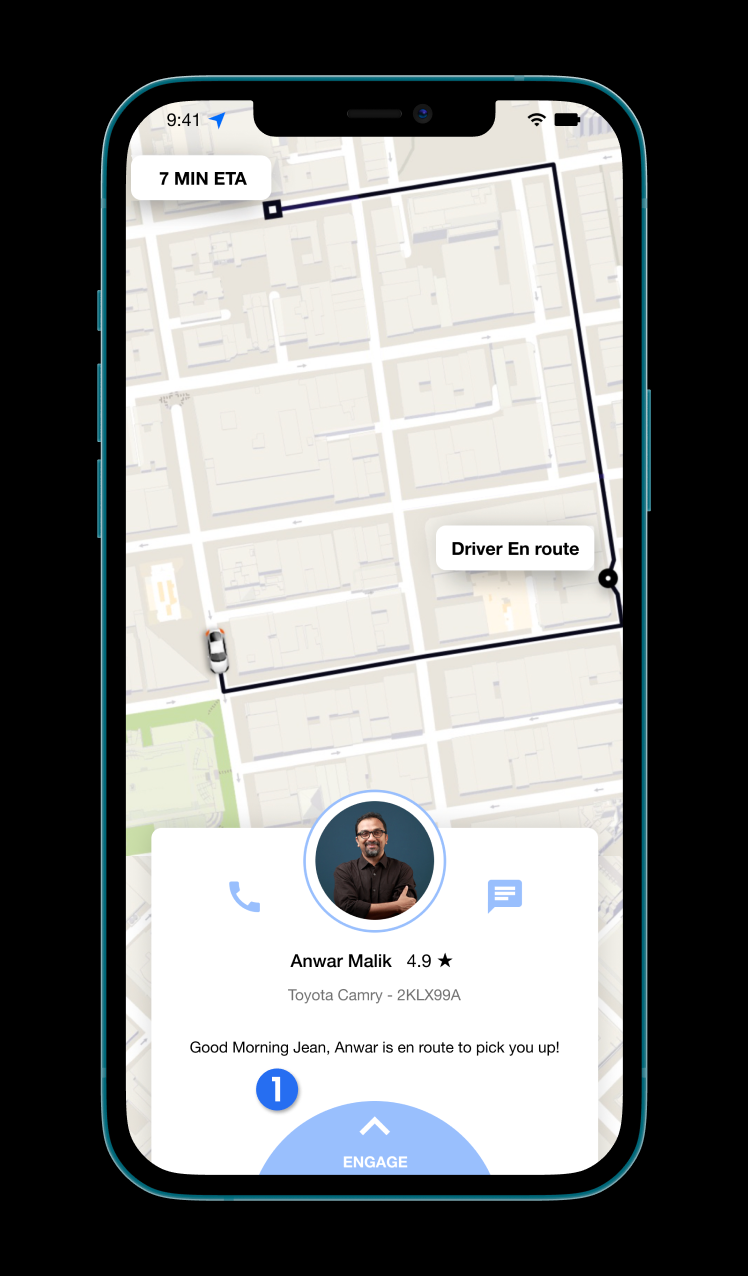
Rider View (Pre Ride/ During Ride)
1) Idleness Aversion 101! Stepping this concept up a notch, we allow the rider to interact with the drivers profile even before the ride begins, as opposed to merely viewing the pickup time.
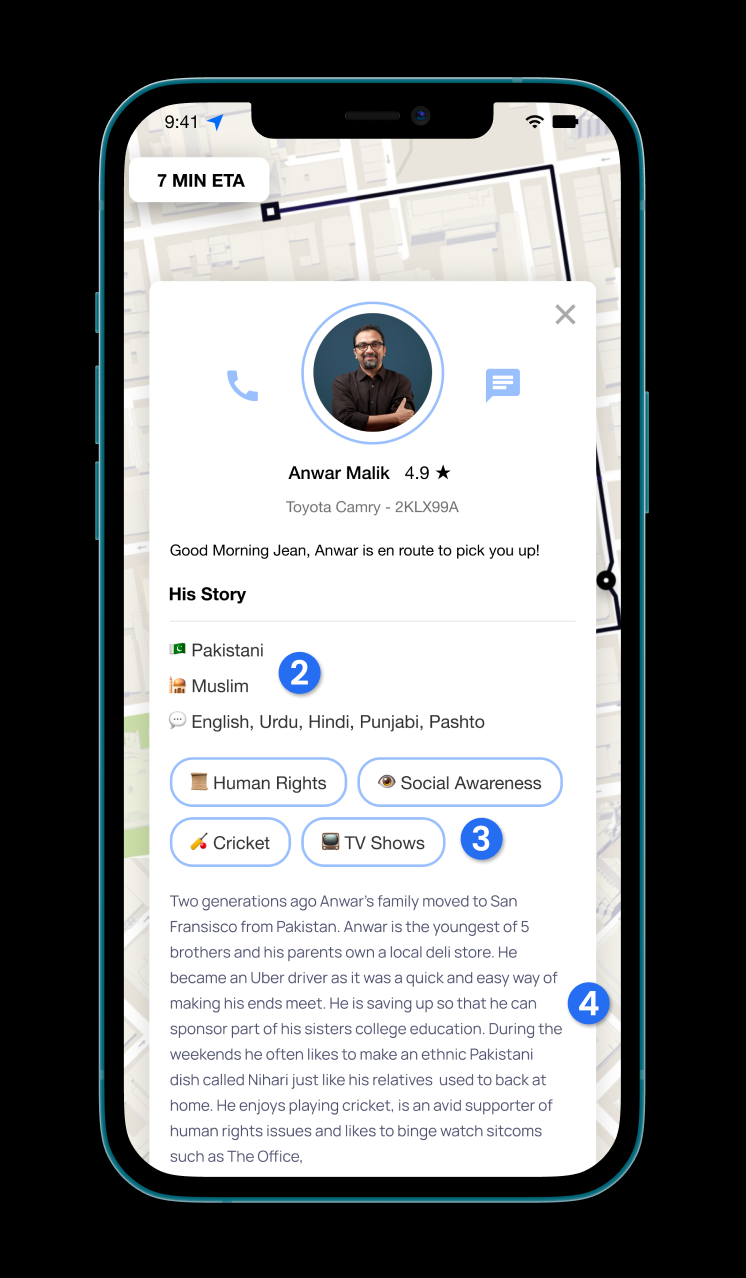
2) Engaging with the driver reveals their unique story that they intended to share through the Uber Voices program along with their basic information such as their nationality, religious practice and language(s) spoken.
3) Drivers unique interests also serve to act as openers for conversations and allow riders a window into their personal interests.
4) Drivers can express themselves through their own unique stories by using this platform. The primary reason for including this was to evoke a sense of empathy from the riders side and transcend the solely transactional nature of Uber rides. Passengers can get a better understanding of who the drivers are and where they come from.
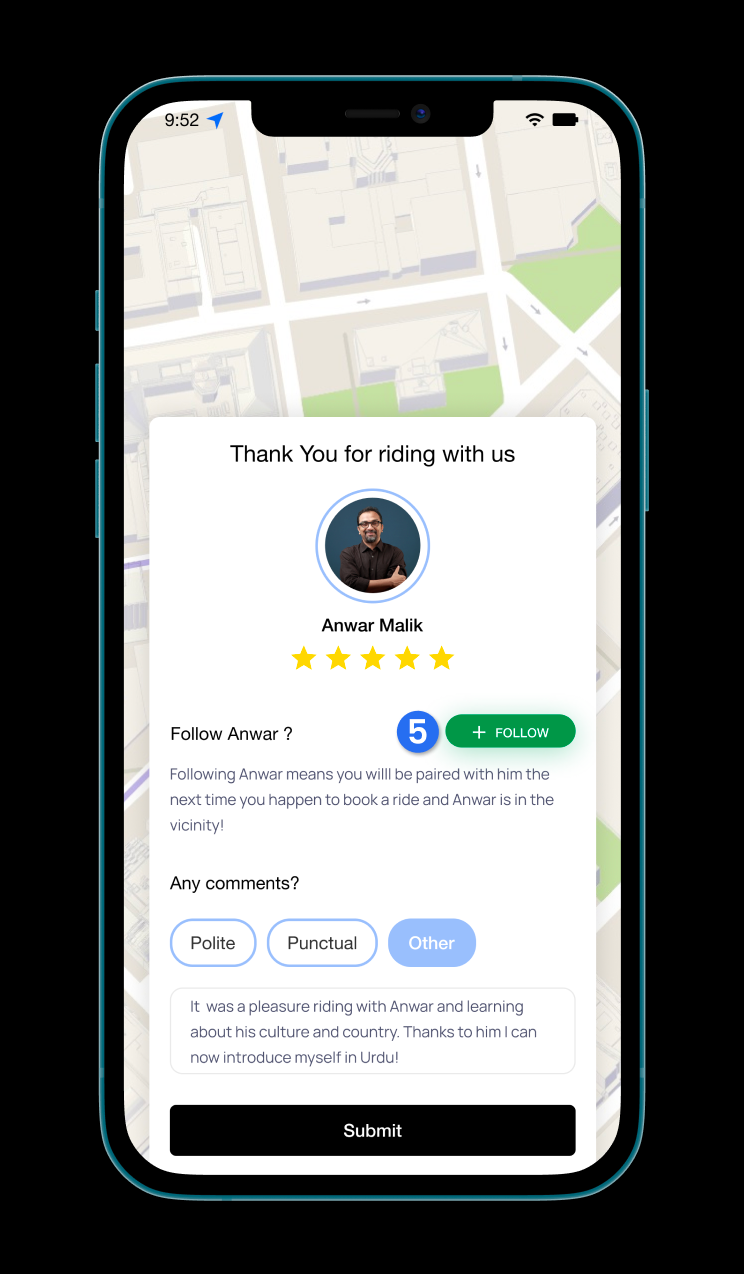
5) Riders may choose to 'Follow' Drivers of their liking, thus creating a recurring relationship between the two.
By facilitating conversation and harnessing the powerful effect of it, we strive to build a better world. A world that respects, understands and appreciates its diversity.
Further Design Considerations
Even after mocking up the final visual designs and concept video, my teammate and I kept questioning each other on how we could improve upon this experience. A few question came to our mind as we evaluated our prototypes:-
1. Given that 68% of hate crime victims suffer from PTSD (according to the International Society for Traumatic Stress Studies), how might we follow up with victims and enforce guidelines via the app for the prevention and subsequent treatments for the victims?
2. It is also likely that the rider may be subject to mistreatment and racial bias by the Uber driver. How might we resolve this?
3. Are there any other measures we can proactively take to decrease bias motivational crimes? We need to rely on factors other than conversation and storytelling pre/ during the rides.
Key Takeaways
There is no ‘best’ solution to any particular problem (let alone ones in the mathematical realm). There are always multiple ways to ameliorate an implemented solution and make it better. In today’s dynamic world, the challenge is always transforming, thereby pushing us designers to constantly think unconventionally and implement solutions that are likely to be adopted. And it’s upto us designers to be on top of our game and churn out meaningful experiences one feature at a time.
Illustration Credit
Home Page & Splash Screen: Tina Charisma via Tina Charisma
Above Fold: Keith Mackenzie via Workable


