KINDLY NOTE
This was a corporate project that I worked on. I was brought onboard once the product had been built and when the team was past the initial research and ideation phase. Owing to this, some salient aspects of the design process have been omitted in the approach section.
— TEAMMATES
Paritosh Chhibber
Abhilekh Choudhary
Neeraj Jadhav
Anil Kumar
Ashlesha Waikos
— MY ROLE
UI/ UX Designer
Associate Product Manager
— TOOLS USED
Design:
Balsamiq, Sketch, Figma, InVision
Project Management:
Jira Software, Confluence
Tech Stack:
Angular, TypeScript, Polymer, Docker, Jenkins, MongoDB, Redis, Elasticsearch, MinIO, Microsoft SQL Server, MySQL, ORACLE, PostgreSQL, IBM DB2, HELM, Kibana, Swagger, AWS- Serverless, EKS, CodeBuild, Lambda, CloudFront, RDS, CloudWatch, DynamoDB, S3, API Gateway, Kinesis Firehose
THE CHALLENGE
Every company has its unique set of goals and targets. Sometimes, these goals are met, sometimes they aren’t. For organisations to survive in today’s competitive age and be the best version of themselves, they need to understand the reasons behind the non achievement of goals so that they can accordingly take action and improve their performance.
THE SOLUTION
Craft a system that allows users to define their objectives, track their completion and monitor the performance of the organisation against objectives at various levels. Also, factor in an in-depth analysis and/ or causes of non achievement of objectives coupled with a thorough view of key metrics. This will allow the organisation to create a balance between their processes and the workload on their respective employees, eventually leading to harmony and efficiency.
THE APPROACH
Understand the Domain
Policy deployment was a new and intricate domain to the team and I, thus, we gained a deep understanding of it by talking to key stakeholders, reading how policy deployment is done and implemented as well as going on the field and talking to end users about their daily jobs in a manufacturing environment.

Vigorously Ideate with Stakeholders
The challenges of a profoundly intricate and new domain were overcome through multiple approaches, including, but not limited to- help users achieve their policy deployment goals and rapidly iterate with stakeholders to arrive at a final solution that is not only robust but also scalable across the entire organization.

Design & Engineer
Being highly agile, we employed a parallel design, build and ship approach to software development. We conducted and participated in demos to potential customers to gather feedback and incorporate that and test it. Once the user flow was approved from the clients end and other stakeholders in the project we got down to the visual designs. Taking cues from the wireframes of the user flow we mocked up several VD's, while keeping the user flow intact.
Keeping in mind that the product had to be horizontally scalable, reliable and low in maintenance we built it out using cloud native technologies.

Constantly Validate
Once features had been rolled out and were actively being used by end users we still set up weekly calls with them to gather rich feedback. Constantly validating what were the pains and joys allowed us to modify solutions in future rollouts to alleviate the frustrations faced by the end users.

MY CONTRIBUTION
I was primarily tasked with conducting user interviews and mocking up wireframes & visual designs for new features that were to be incorporated into the software. Additionally, my role went on to further encompass product management. I was involved in numerous story pointing sessions and even had the opportunity to lead entire sprints as scrum master. Finally, I was involved in product demos to the client at the end of every sprint where I walked the client through the features worked on in the sprint. My role mediated between understanding and jotting down client requirements, mocking up wireframes & visual designs and writing down product specifications.
Final Design Outcome
drag the slider below from left to right!

the opportunity area
ORGANISATIONS + NEED + INSIGHT
organisations: seeking to bolster their performance
need: to effectively track their goals & outcomes
insight: to avoid corporate failures
The performance of any manufacturing organisation is highly dependant on its abilities to effectively track and manage its goals and objectives.
This is how we synchronised the value and subsequent performance of manufacturing organisations.
This is how we designed a robust system that percolates top level business KPIs down to the floor level.
This is how we bolstered & improved organisation performance through tracking and monitoring business metrics.
⬇️
Organisation Structure - A birds eye view of the current state of affairs

- • A unified, all encompassing view of all the employees of the entire organisation. The feature gives the user an idea of who is failing to meet metrics and where they may need to step in and offer assistance. This gives clarity to team & individuals on what they need to drive progress.
• The organisation structure diagram allows the user to view every persons specific KPI's in the company along with other important aspects such as top performers and employees needing assistance in order to complete their targets. This allows them to 'split' and take on their employees KPI so they may help them achieve their target goals too.
• Filtering by Status allows for a quick deep dive into employees who have to pick up the slack or ones who have attained their goals, thus improving user management.
Deployment Trees - High Level Granular Percolation of Company Objectives

- • Enables users to get an organisation wide snapshot of objective completions from the CEO to the junior most employee along with subsequent corrective actions for objectives that are dwindling.
- • Provides users with an extensive list of their respective KPI’s for the current financial year along with their subordinates KPI’s. By colour coding each individual KPI node based on its ‘health’, we facilitated quick decision making and transparency across the entire ecosystem.
• Eases the performance analysis on the KPI and enables users to take appropriate actions in a timely manner.
- • Organisation/ Plant team members are be able to define the complete organisation structure and assign the KPIs and break down units to people (while being used in sync with organisation structure reporting).
Custom Reports - Tailored reports for deeper & richer analyses
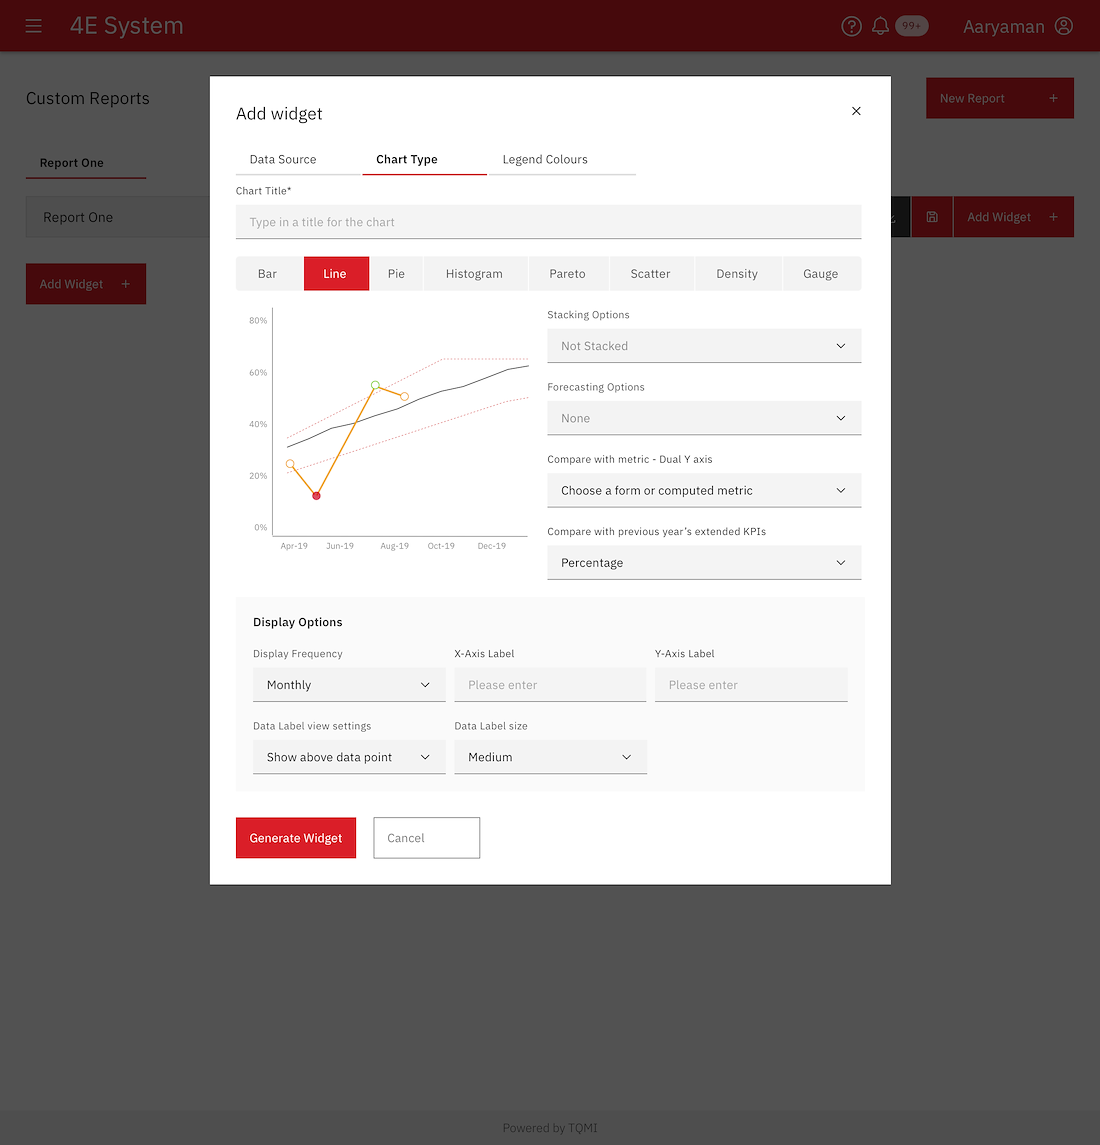
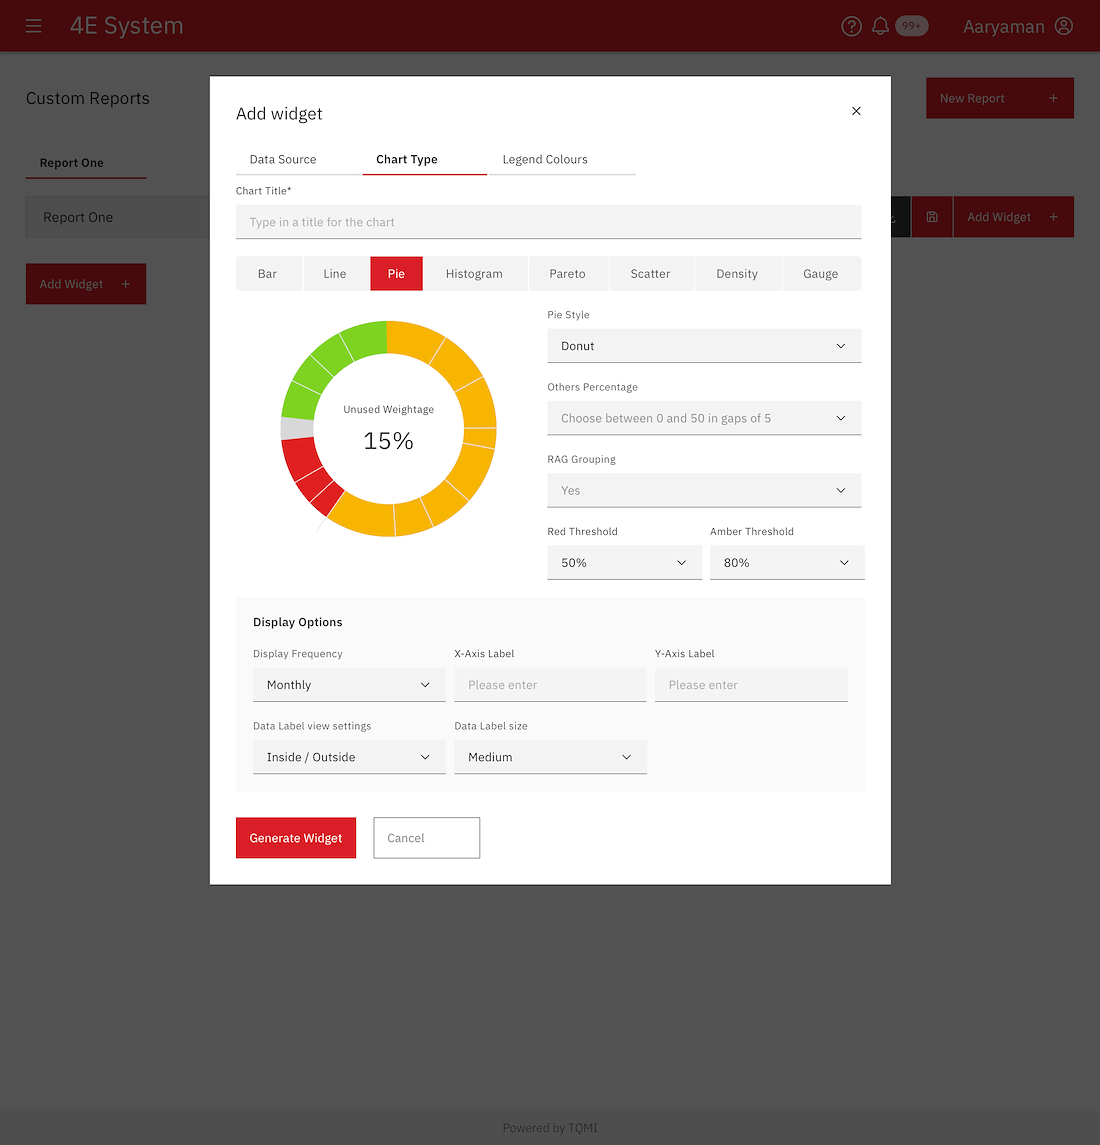
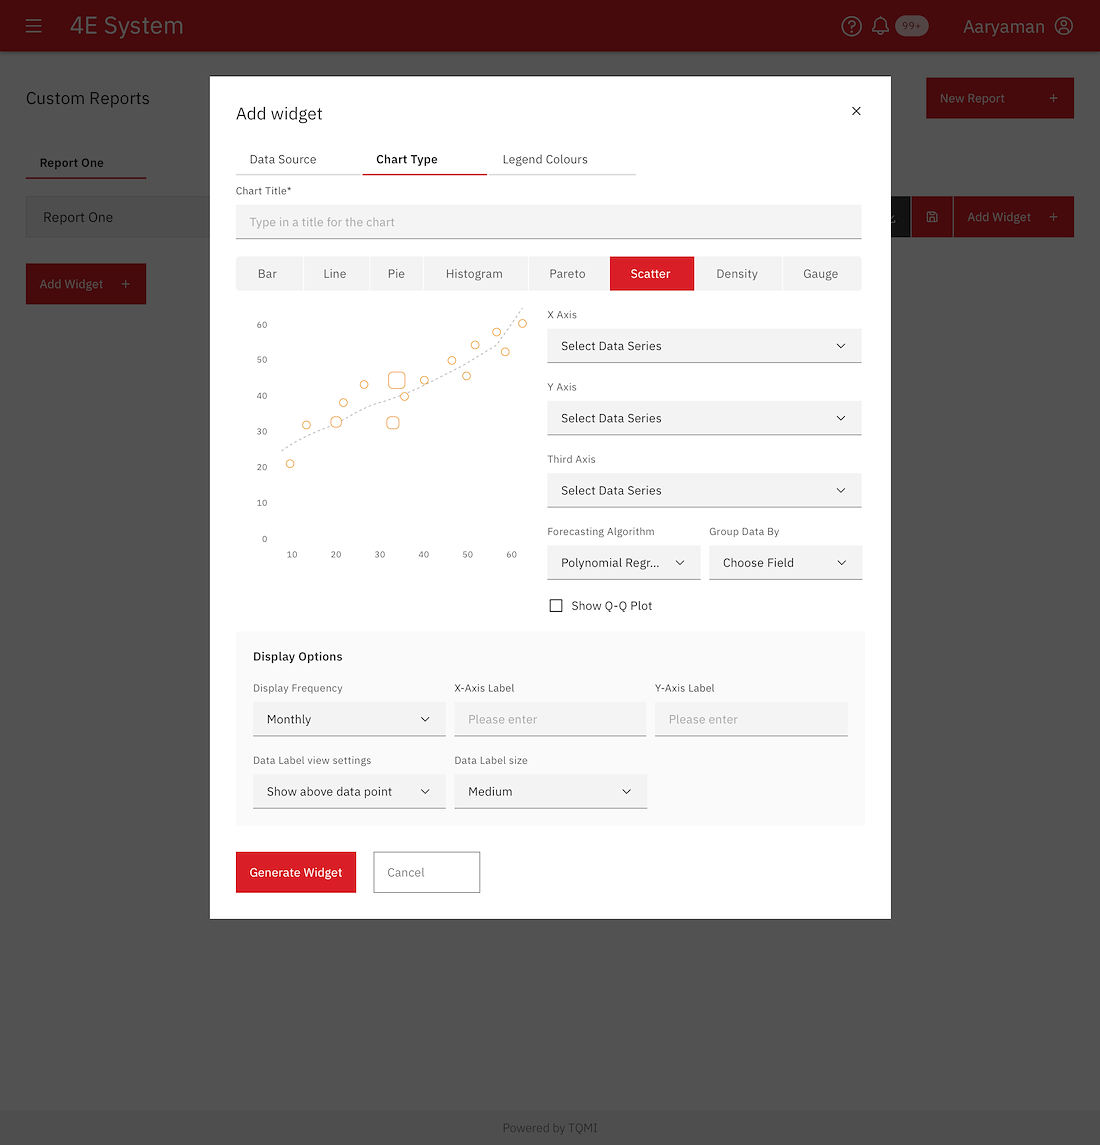
- • Custom reports and the dashboard module allows users to be able to understand these reasons of non achievement.
• Making use of some tools, users can create reports tailored to their own purpose. Users can also add widgets and assign these widgets to various data representations which help in various analyses.
• User can create and share meaningful insights with teams and colleagues.
KPI Scorecard – Ensuring workplace transparency
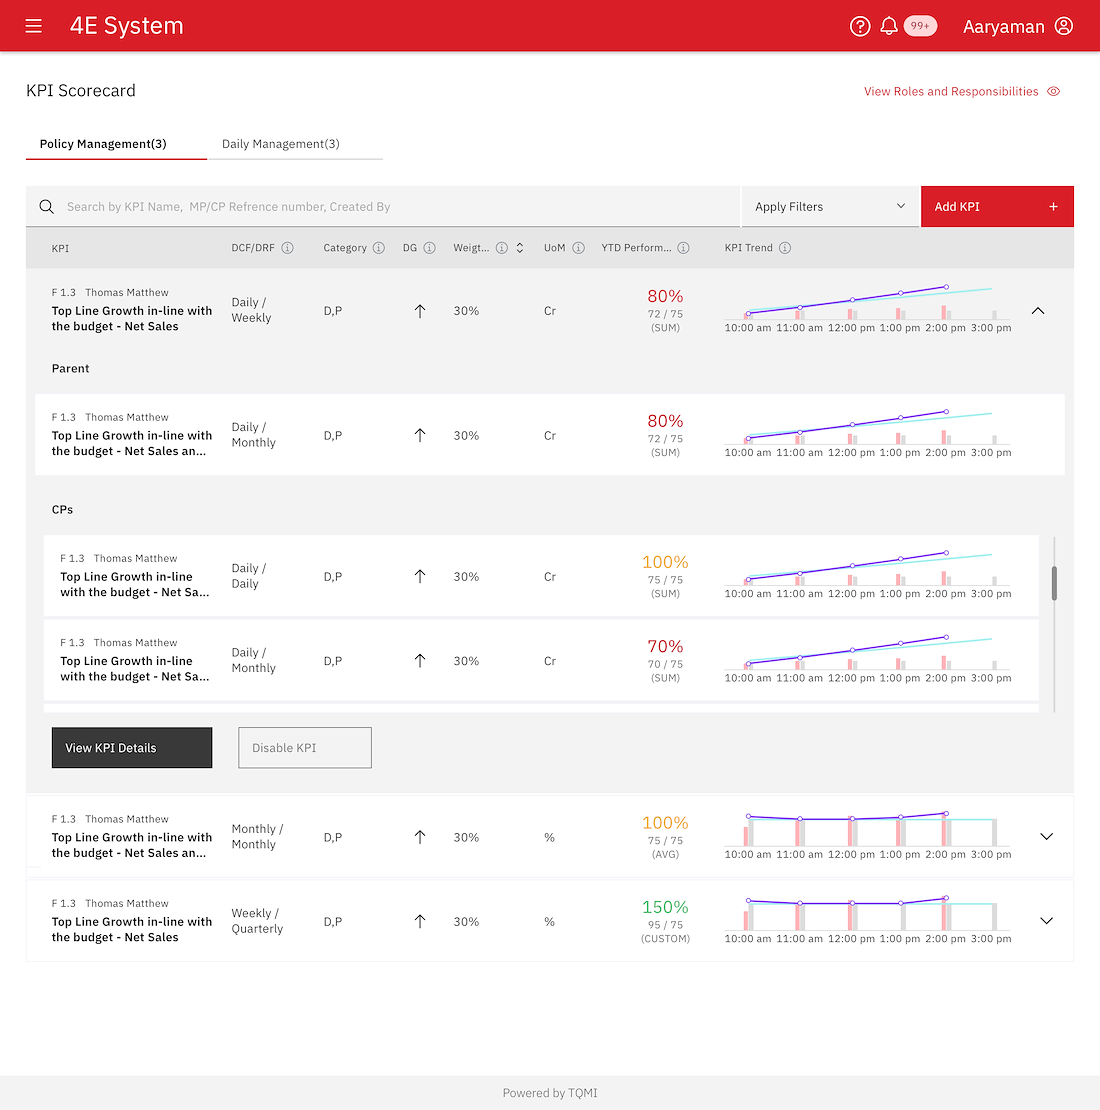
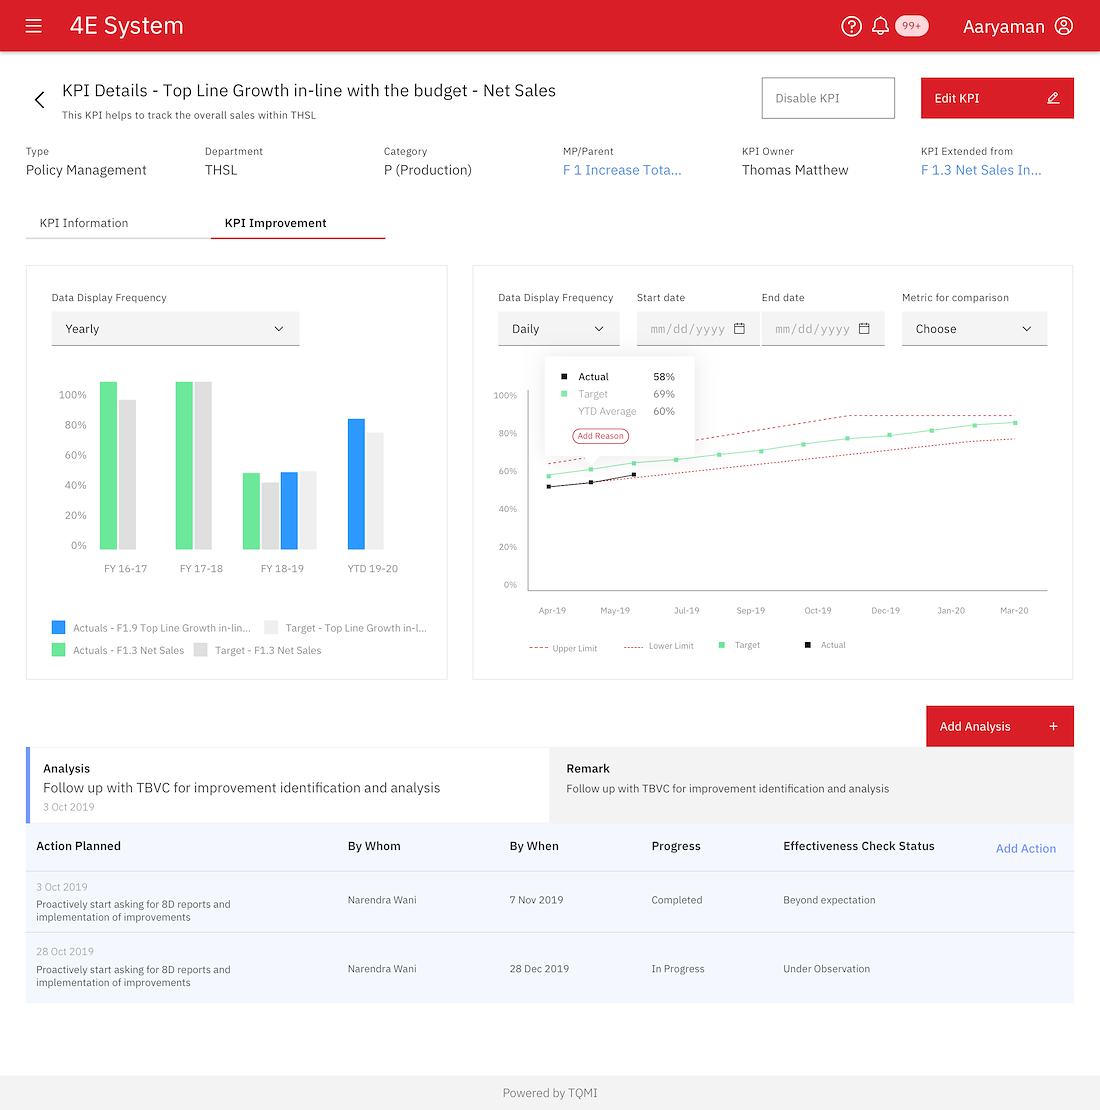
- • Individuals get a view of all allocated KPIs or Sub-Units with necessary details where they will be able to update progress and create action plans.
• Concise view of salient metrics pertaining to the KPI allow the user to quickly grasp trend and performance. These important metrics such as- Data Capture Frequency, Direction of Goodness, Unit of Measurement and KPI Trend propel performance through real time feedback, allowing users to act on them instantaneously.
• If a user is interested in delving into further details of a particular KPI, they can expand it to view the respective KPIs parents and children (aka Control Points).
KPI Definition - Kaizen begins here

- • The KPI creation screen is an extremely thorough input screen that makes the arduous task of entering numerous KPI details as easy as possible by providing various information.
• The hierarchical KPI Listing allows users to view their own KPI’s, their subordinates KPIs and their parents KPIs at a glance and provides them with clarity on which level to slot in their respective KPI.
• Future consumption of KPI with respect to people and departments allows users to gauge beforehand, the extent of percolation and possible ramifications to business outcomes.
Abnormalities - Specific, Measurable & Action based

- • Owing to tight margins and little to no room for error, a common occurrence in manufacturing organisations are process abnormalities. These abnormalities are digitised in the 4E system and tracked efficiently.
• Analyses on these abnormalities further track corrective action items implemented.
• Digitisation of these log books not only allowed for a reference in the future but was also a crucial step towards Industry 4.0.
Integrations - The forefront of Enterprise Systems

- • 4E seamlessly integrates with SAP/ SCADA/ 3rd party customer applications, thereby eliminating the customers manual effort and intervention for data sync.
Audit Trails - Everything is tracked and accounted for, every single thing

- • Exhaustive audit trails captured every single change to predefined business objectives and policies, negating the chances of data falsification by users.
Key Takeaways
Simultaneously tracking organisational goals whilst managing business objectives and employees productivity is no easy feat. A meticulous system needs to be put into place and due diligence needs to be followed to achieve the same. Whether it's eliminating mura, mudi, muda or abiding by the PDCA methodology, 4E greatly enhances the organisational performance by housing features that tackle these issues across different manufacturing sectors. Whether you are an organisation in the chemical industry seeking to maintain the FRC in cooling towers or an automobile giant looking to reduce assembler repetitive lapses in transmission assemblies, 4E can and will help you realise your organisational goals.